Forty5Park
Role
Staff Product Designer
Tools
Figma, Claude Code
Year
Overview
An AI platform built to replace spreadsheets and gut instinct
Forty5Park is an AI-powered platform built for real estate companies — helping acquisition teams evaluate deals, forecast property valuations up to a year ahead, and benchmark properties against sector peers. I joined as staff product designer, working in Figma and, for parts of the build, directly in Claude Code.
Real estate acquisitions involve dozens of variables — location, unit mix, market trends, forecasted returns — yet most teams were still evaluating them across spreadsheets and instinct rather than one connected view.
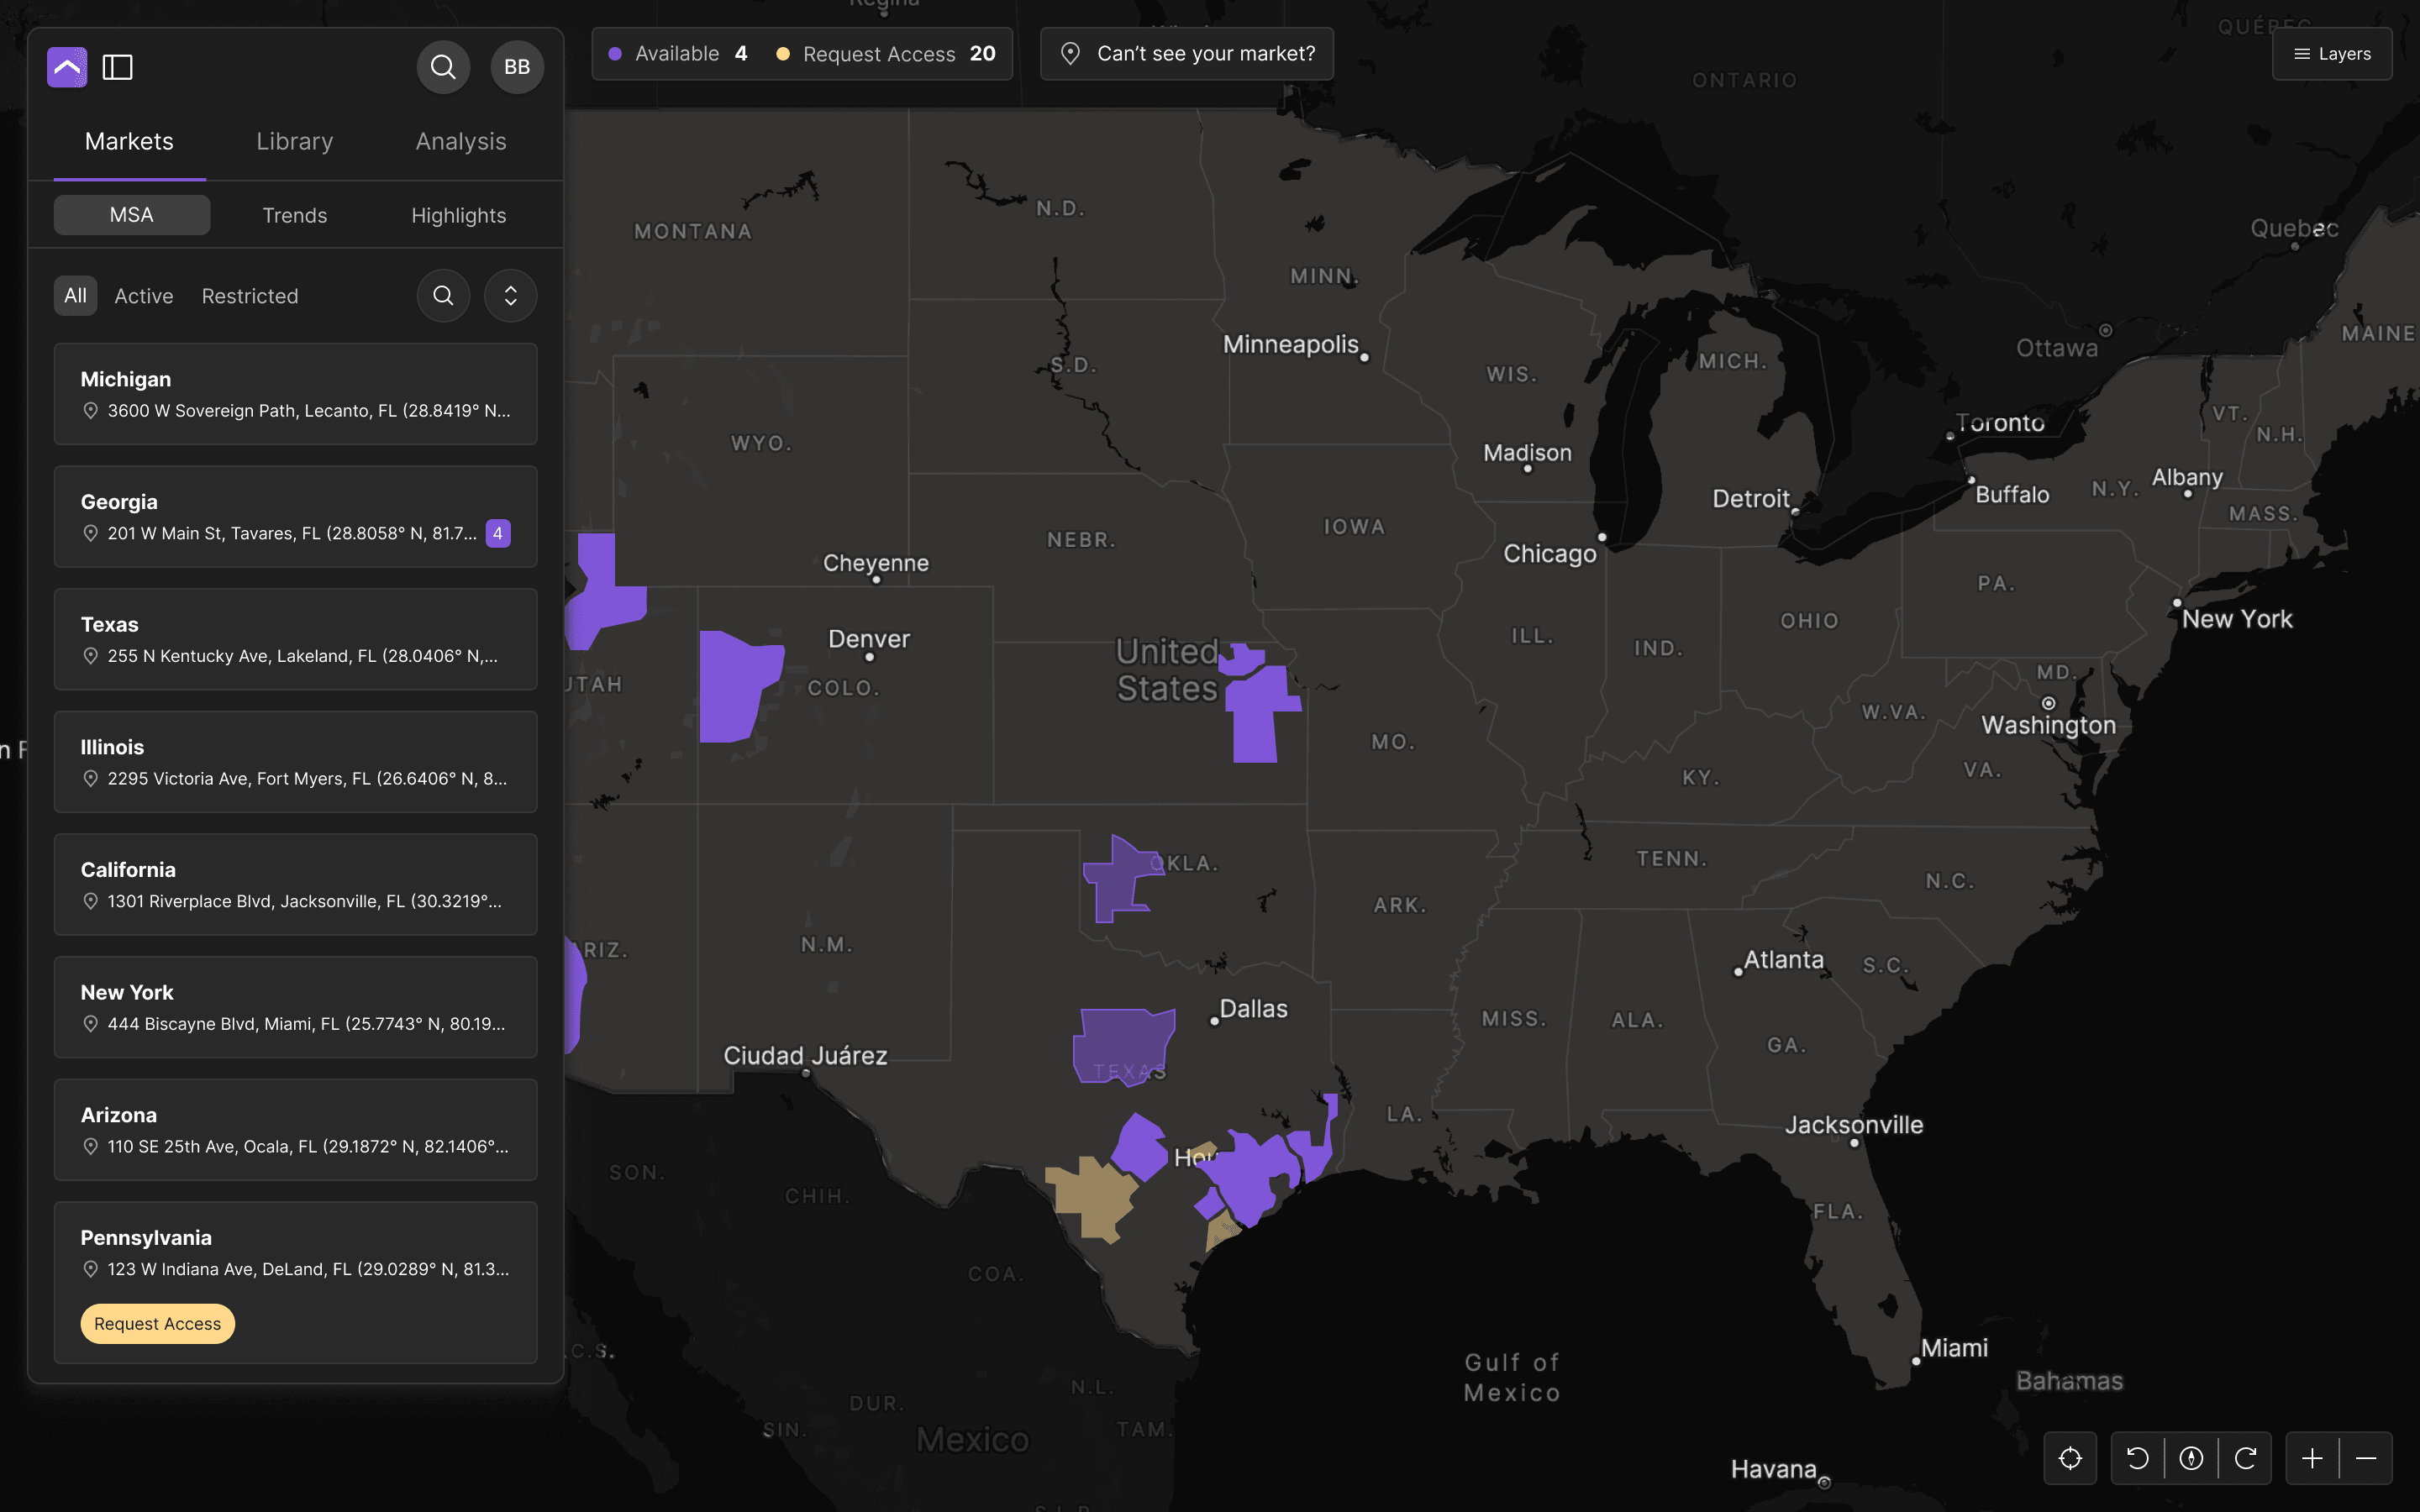
Forty5Park's map view — acquisition targets plotted across active markets, with a filterable list alongside.
Pain Points
One deal, evaluated across a dozen disconnected sources
Acquisition teams were juggling multiple disconnected tools — spreadsheets for financial modeling, separate resources for market data, no single place to forecast a property’s value or see how it stacked up against comparable deals. Every acquisition decision meant manually pulling numbers together from different sources before a team could even start evaluating whether a deal was worth pursuing.
Forecasting a property’s value a year out, or benchmarking it against comparable deals, wasn’t something most teams could do quickly — it meant assembling market data by hand, project by project, rather than seeing it inside the same view as the deal itself.
Project Scope and Design
Designing for the deal, not the underlying data
The core design challenge was making complex financial and market data feel actionable rather than overwhelming. I structured the interface around decision points — what does an acquisition manager actually need to know right now to move a deal forward — rather than around the underlying data model, and that question shaped every screen from the map view down to a single property’s detail page.
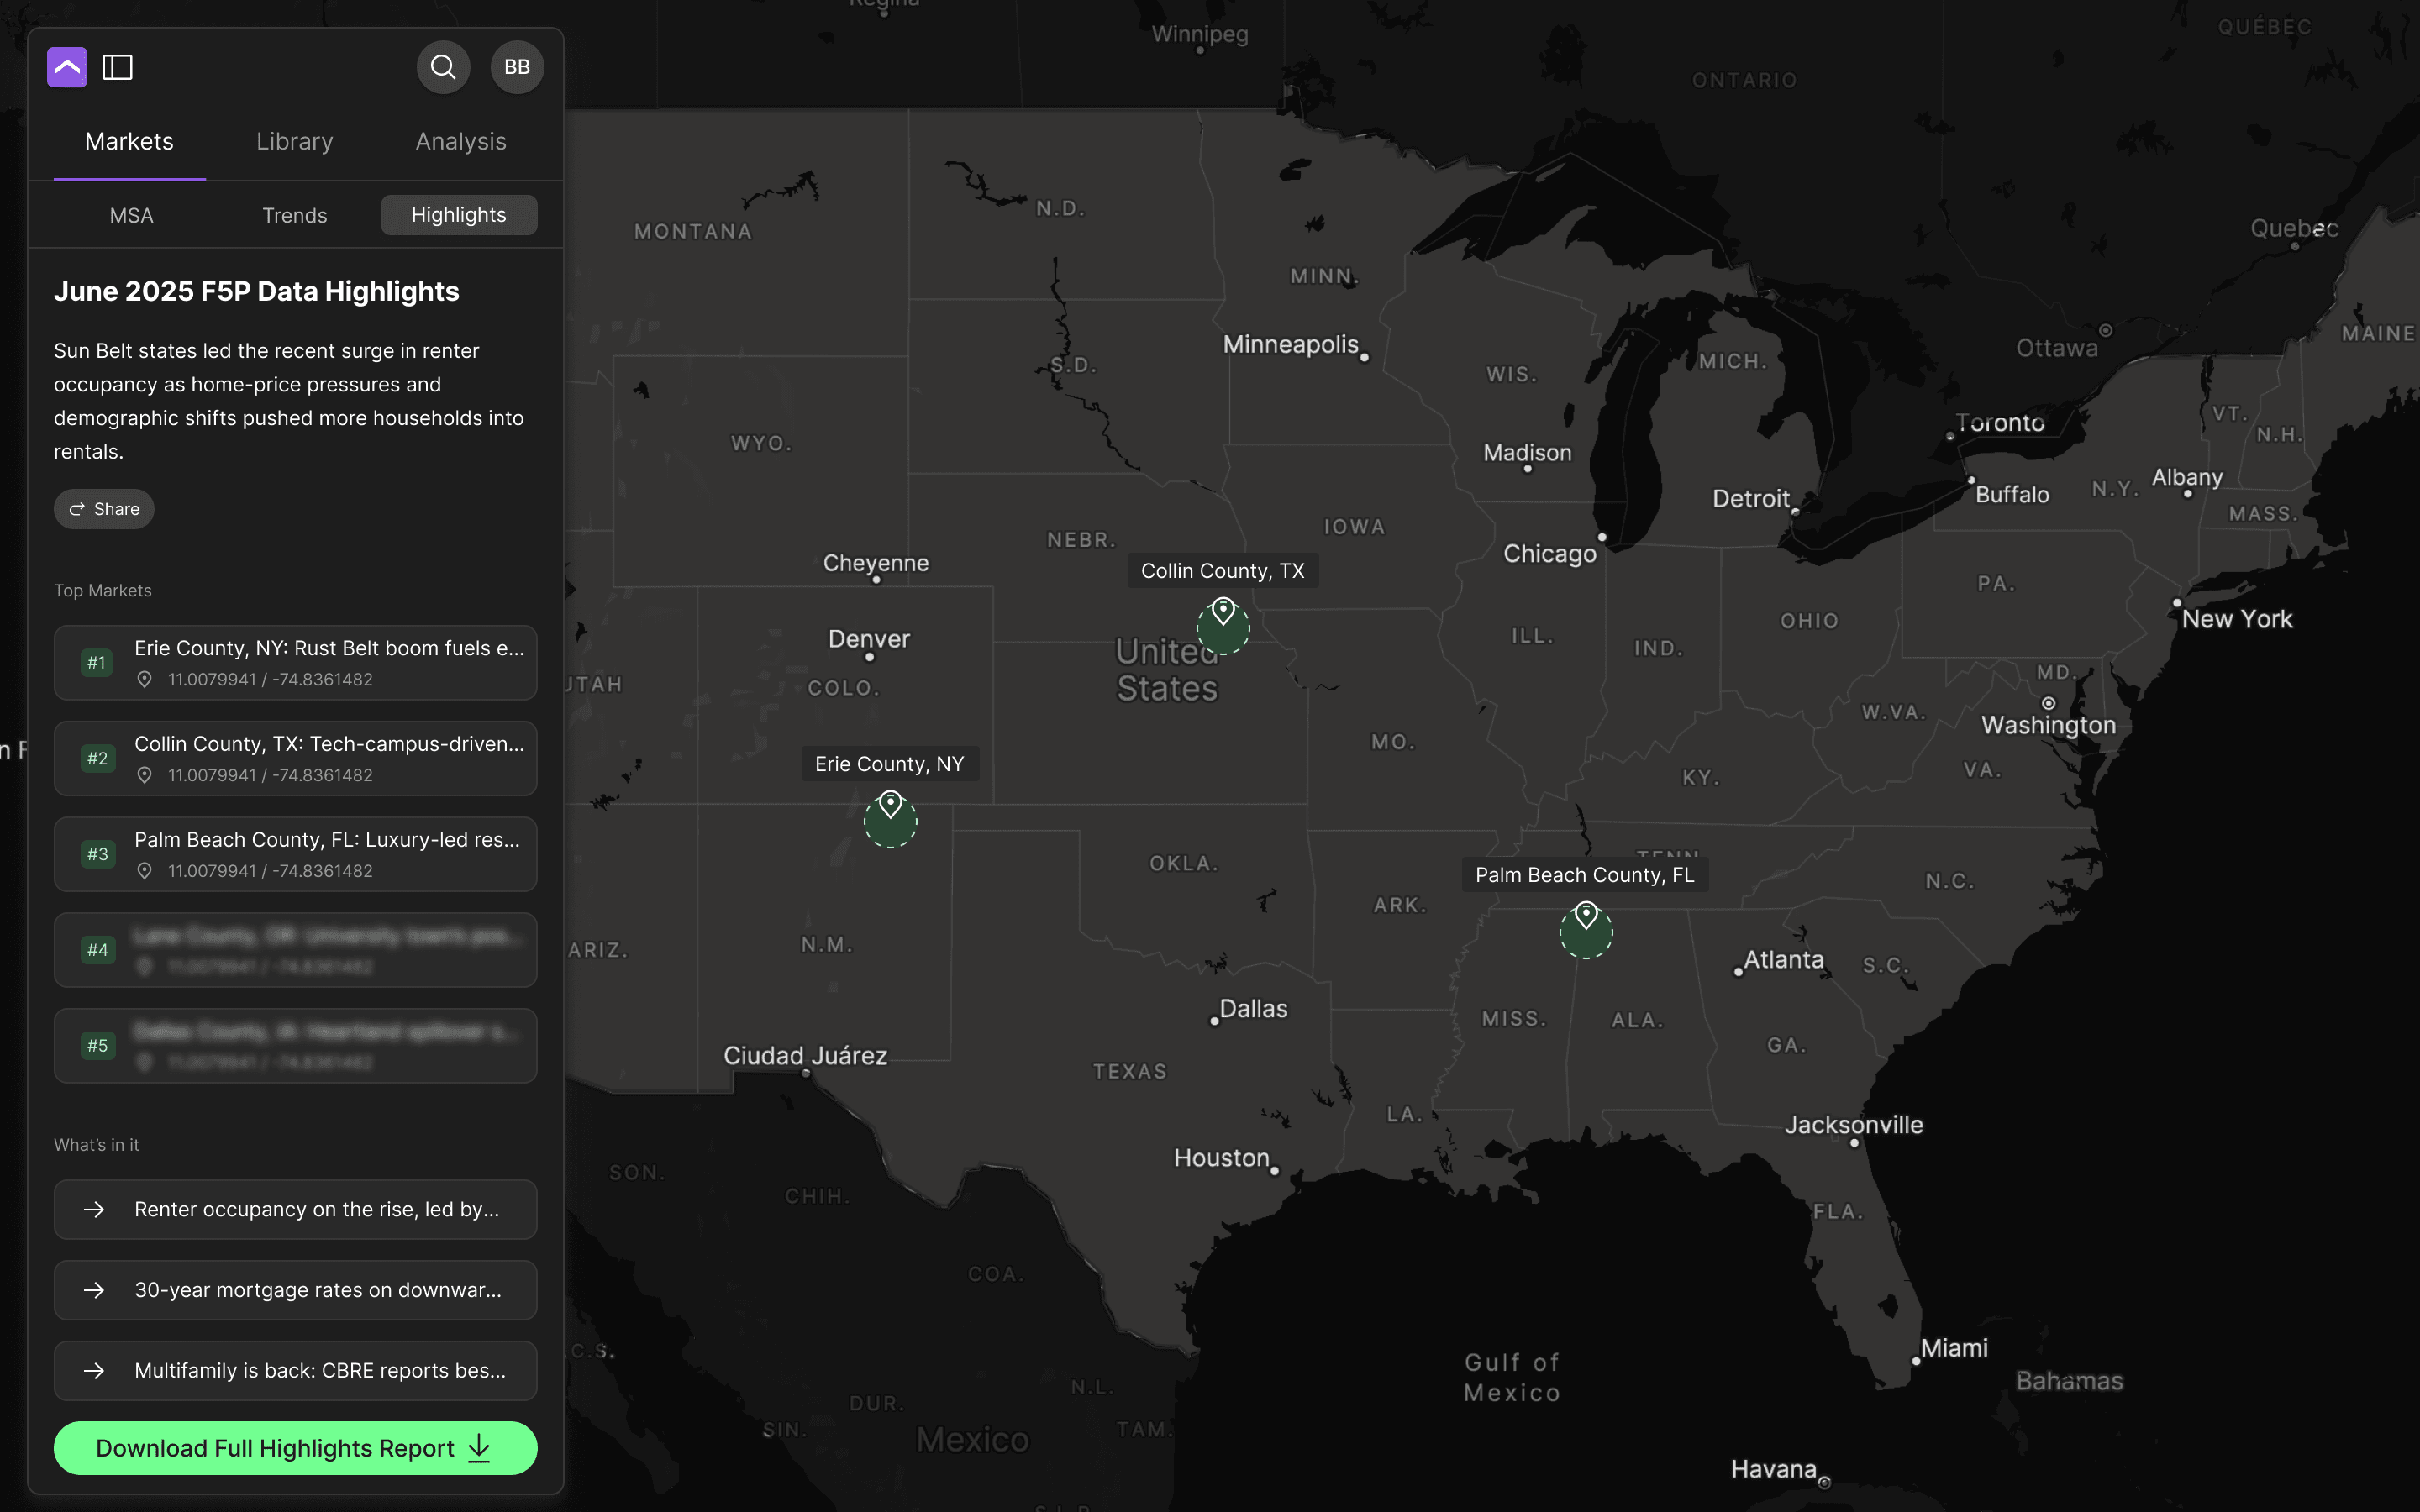
Market highlights — a summary panel surfacing recent deal activity.
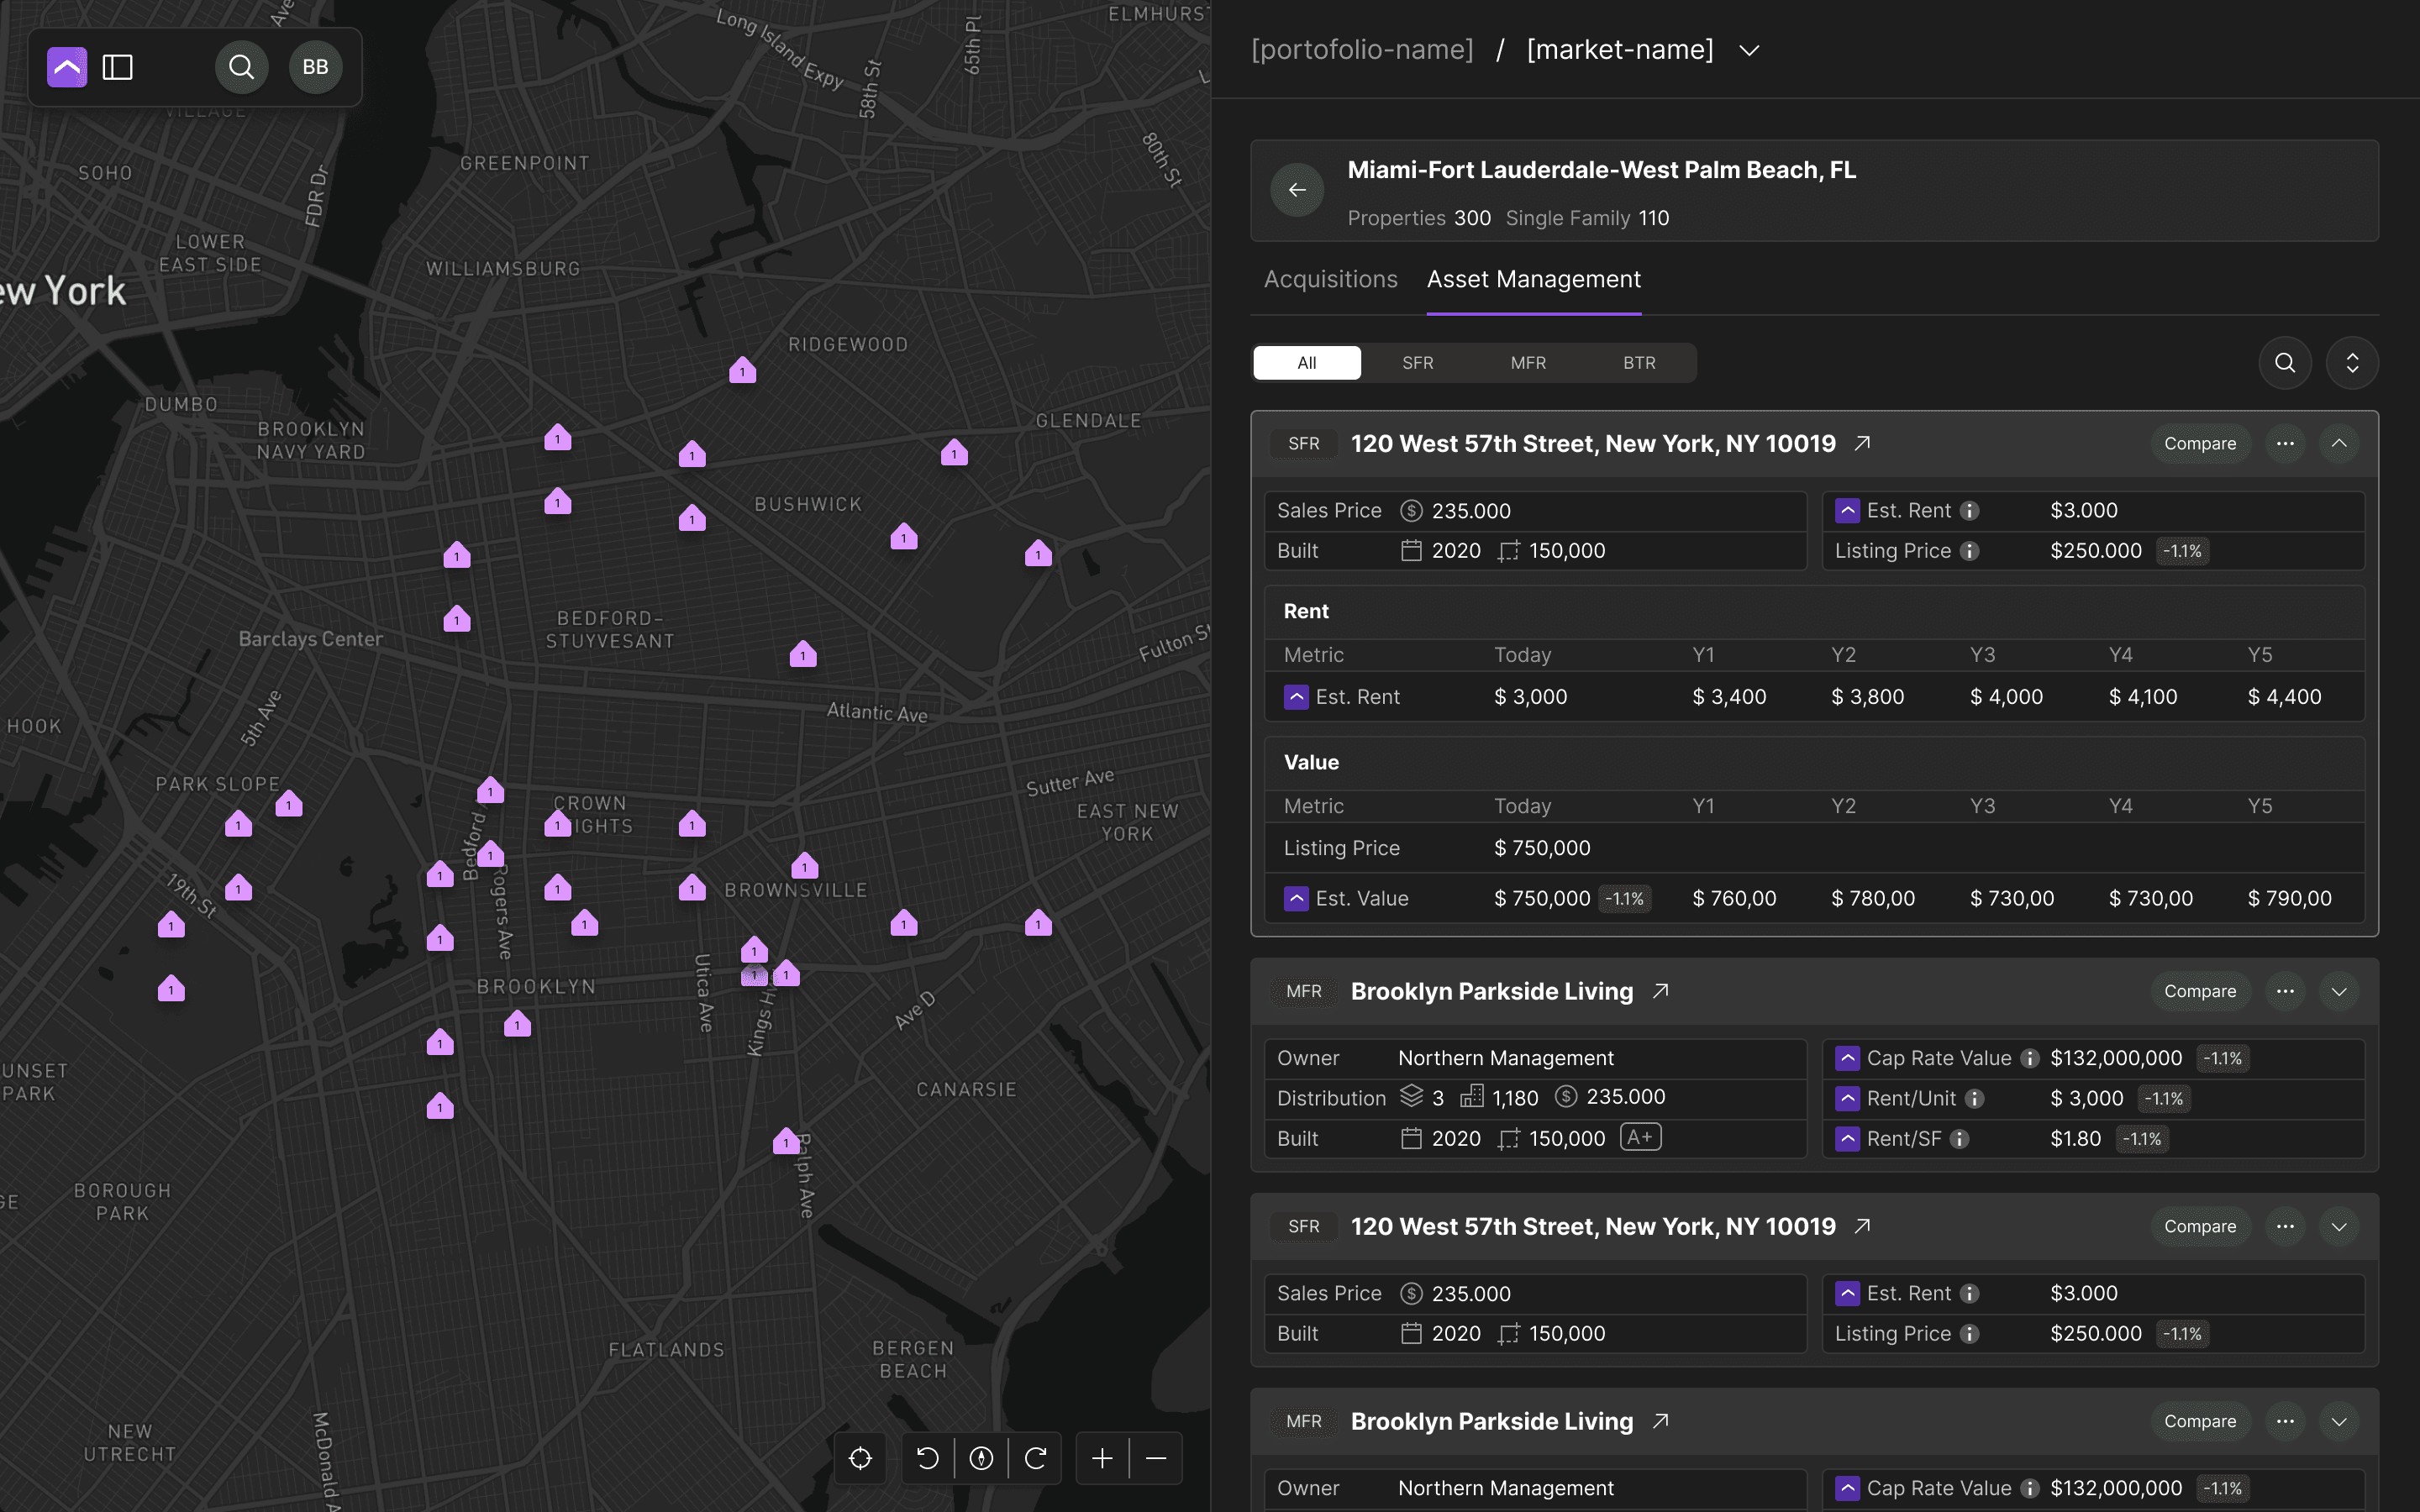
Zoomed into a single metro area, showing deal density by cluster.
Challenges
Three kinds of real-time complexity, one coherent screen
The genuinely hard part of this project wasn’t any single screen — it was reconciling three different kinds of real-time complexity into one interface: predictive valuation modeling, geolocation data across active markets, and live market analytics, all updating independently. Any one of those could carry a dashboard on its own; showing all three together without burying the acquisition decision underneath them was the actual design problem. The fix was the same decision-point framing from Project Scope and Design, applied more strictly here — every predictive number and every map layer had to earn its place by answering a specific question a manager would actually ask, or it didn’t make the screen.
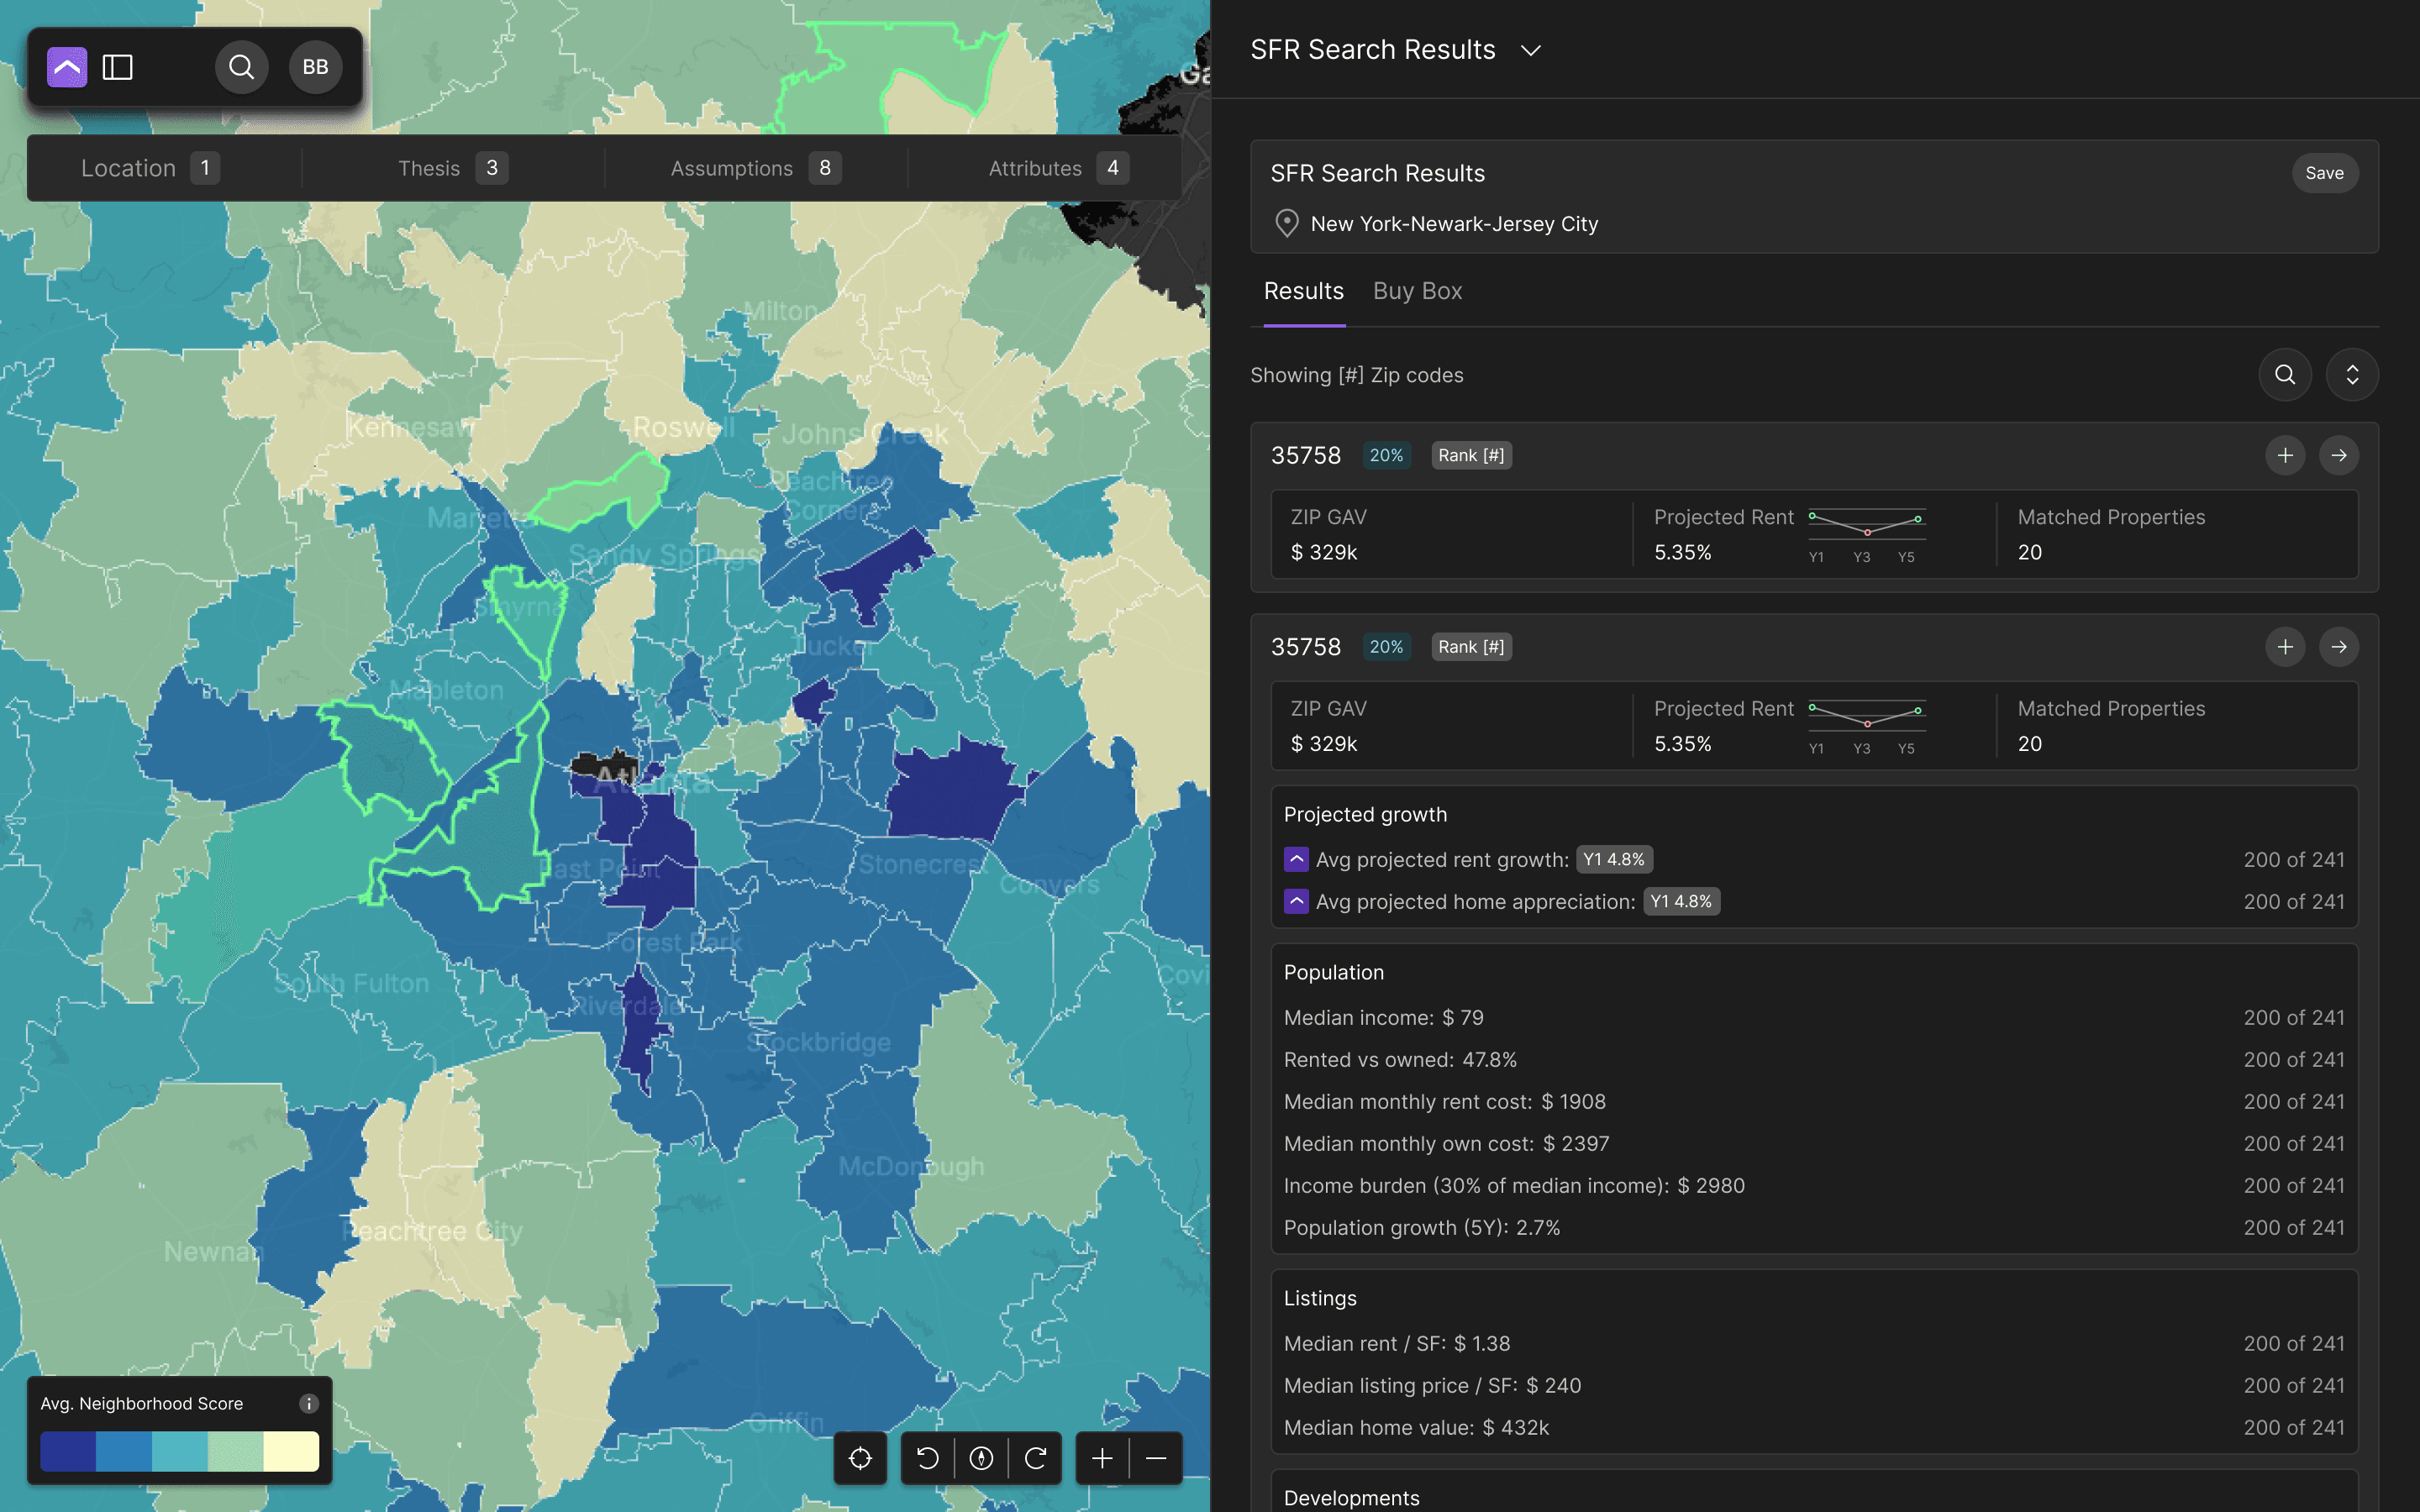
Predictive valuation — a heatmap forecasting property values by neighborhood.
Strategic Contributions
What I owned, start to finish
My role covered the platform’s design end to end — from structuring the core interaction model around decision points, through UI design for the map, forecasting, and portfolio views. Claude Code was part of the actual workflow here, not just implementation after the fact — moving between design and working code let me test how the AI-driven data actually behaved in the interface, rather than designing against a static mockup of it.
The Final Phase
One platform, in place of a stack of spreadsheets
Acquisition teams moved from juggling spreadsheets across disconnected tools to evaluating and progressing deals inside a single platform — one place to see a property, its forecasted value, and how it compares to the market.
The result isn’t a number I can point to — it’s a workflow that used to take multiple tools and now takes one, with the AI-driven forecasting and geolocation data built into the same view a manager already uses to make the call.
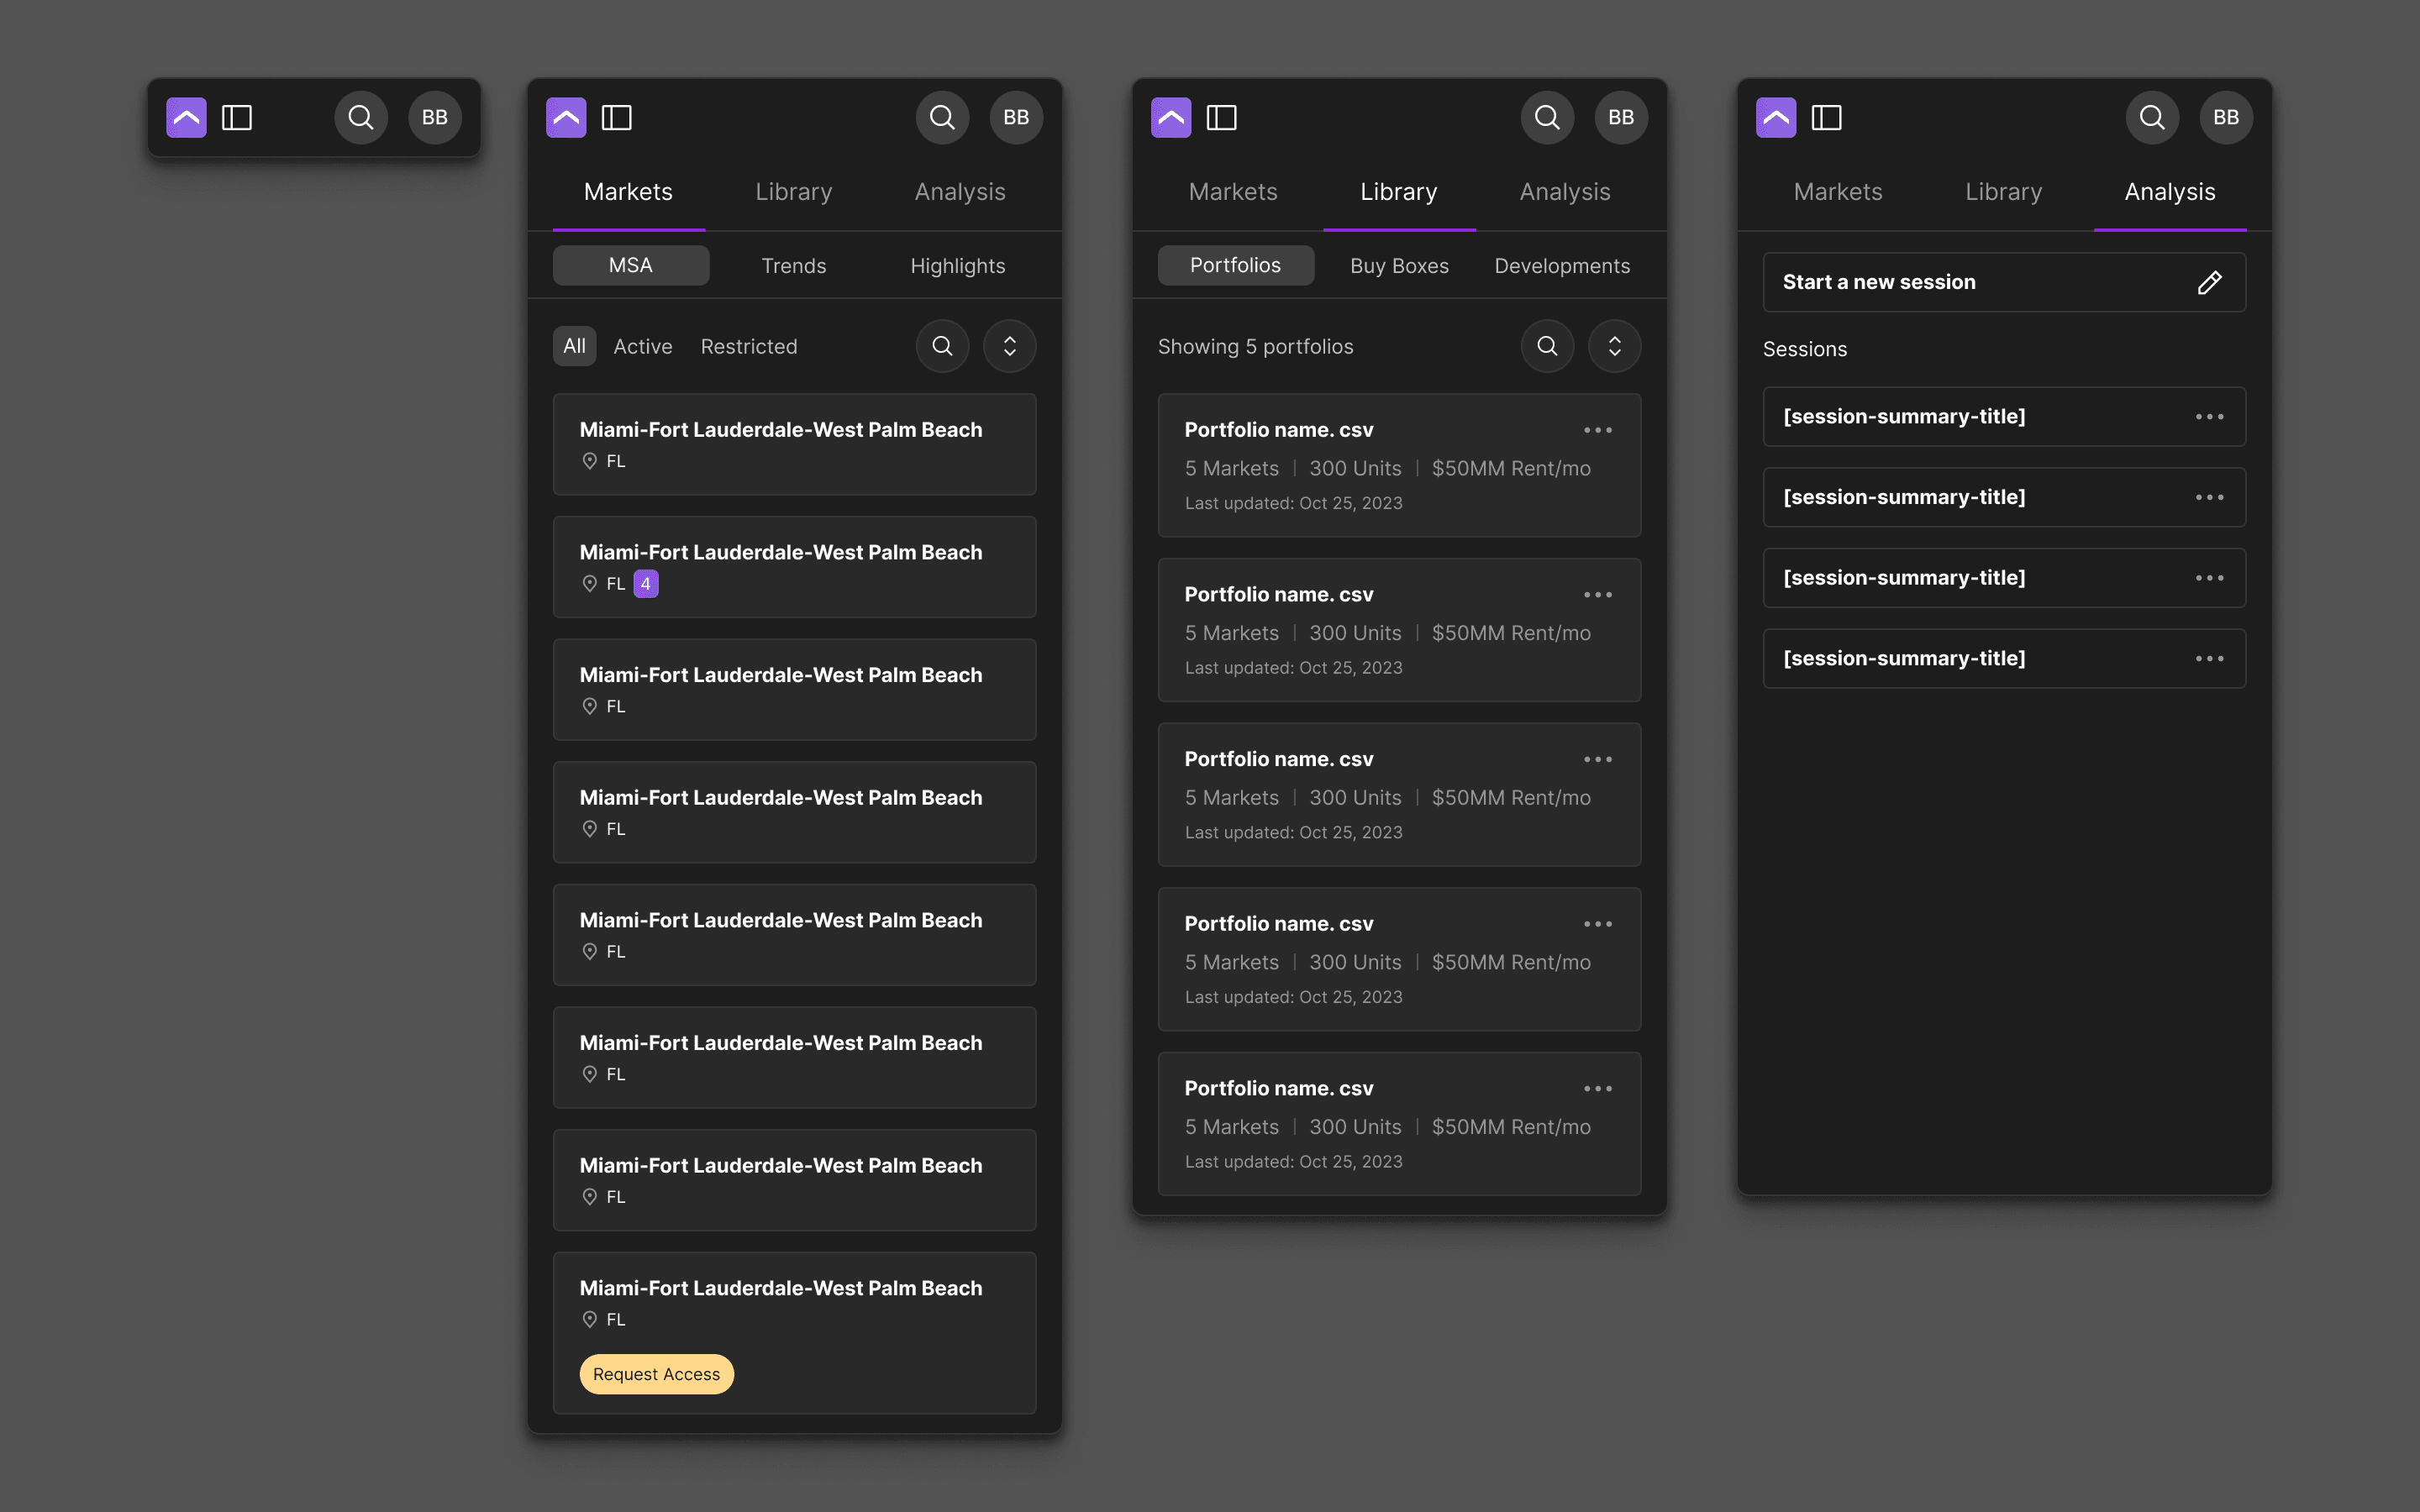
Portfolio comparison — multiple acquisitions evaluated side by side.
Saved analysis sessions, for returning to a deal in progress.
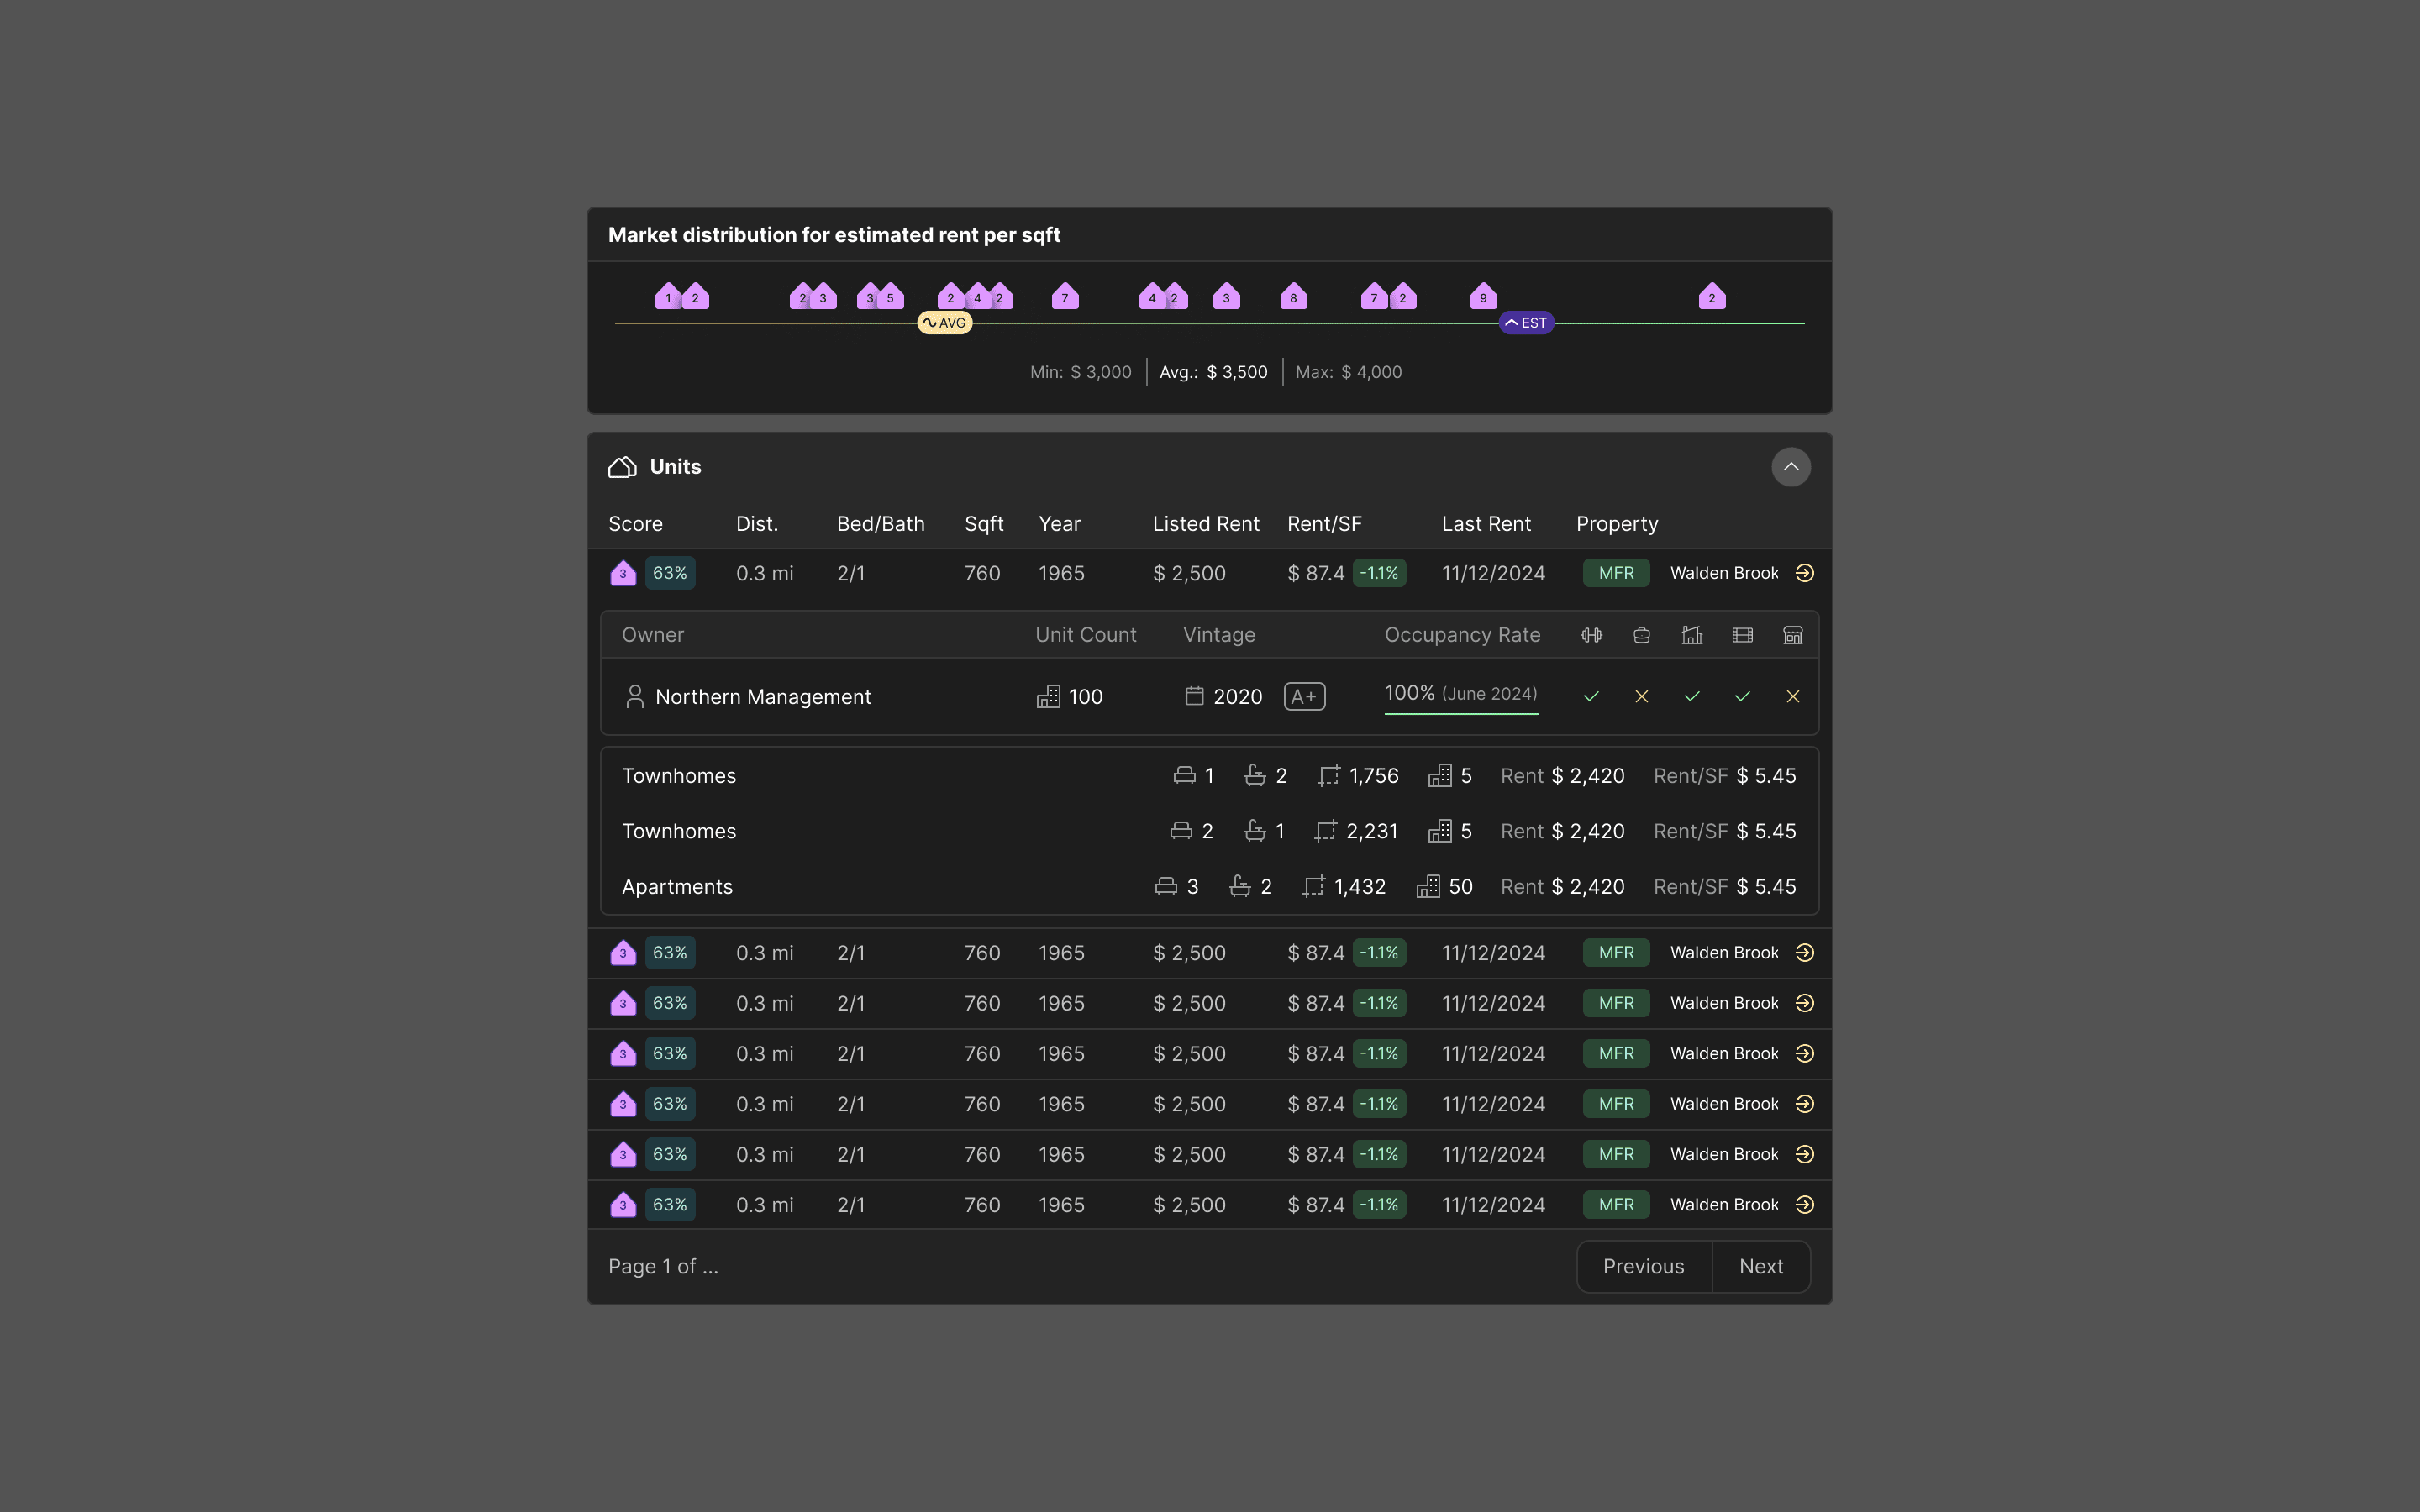
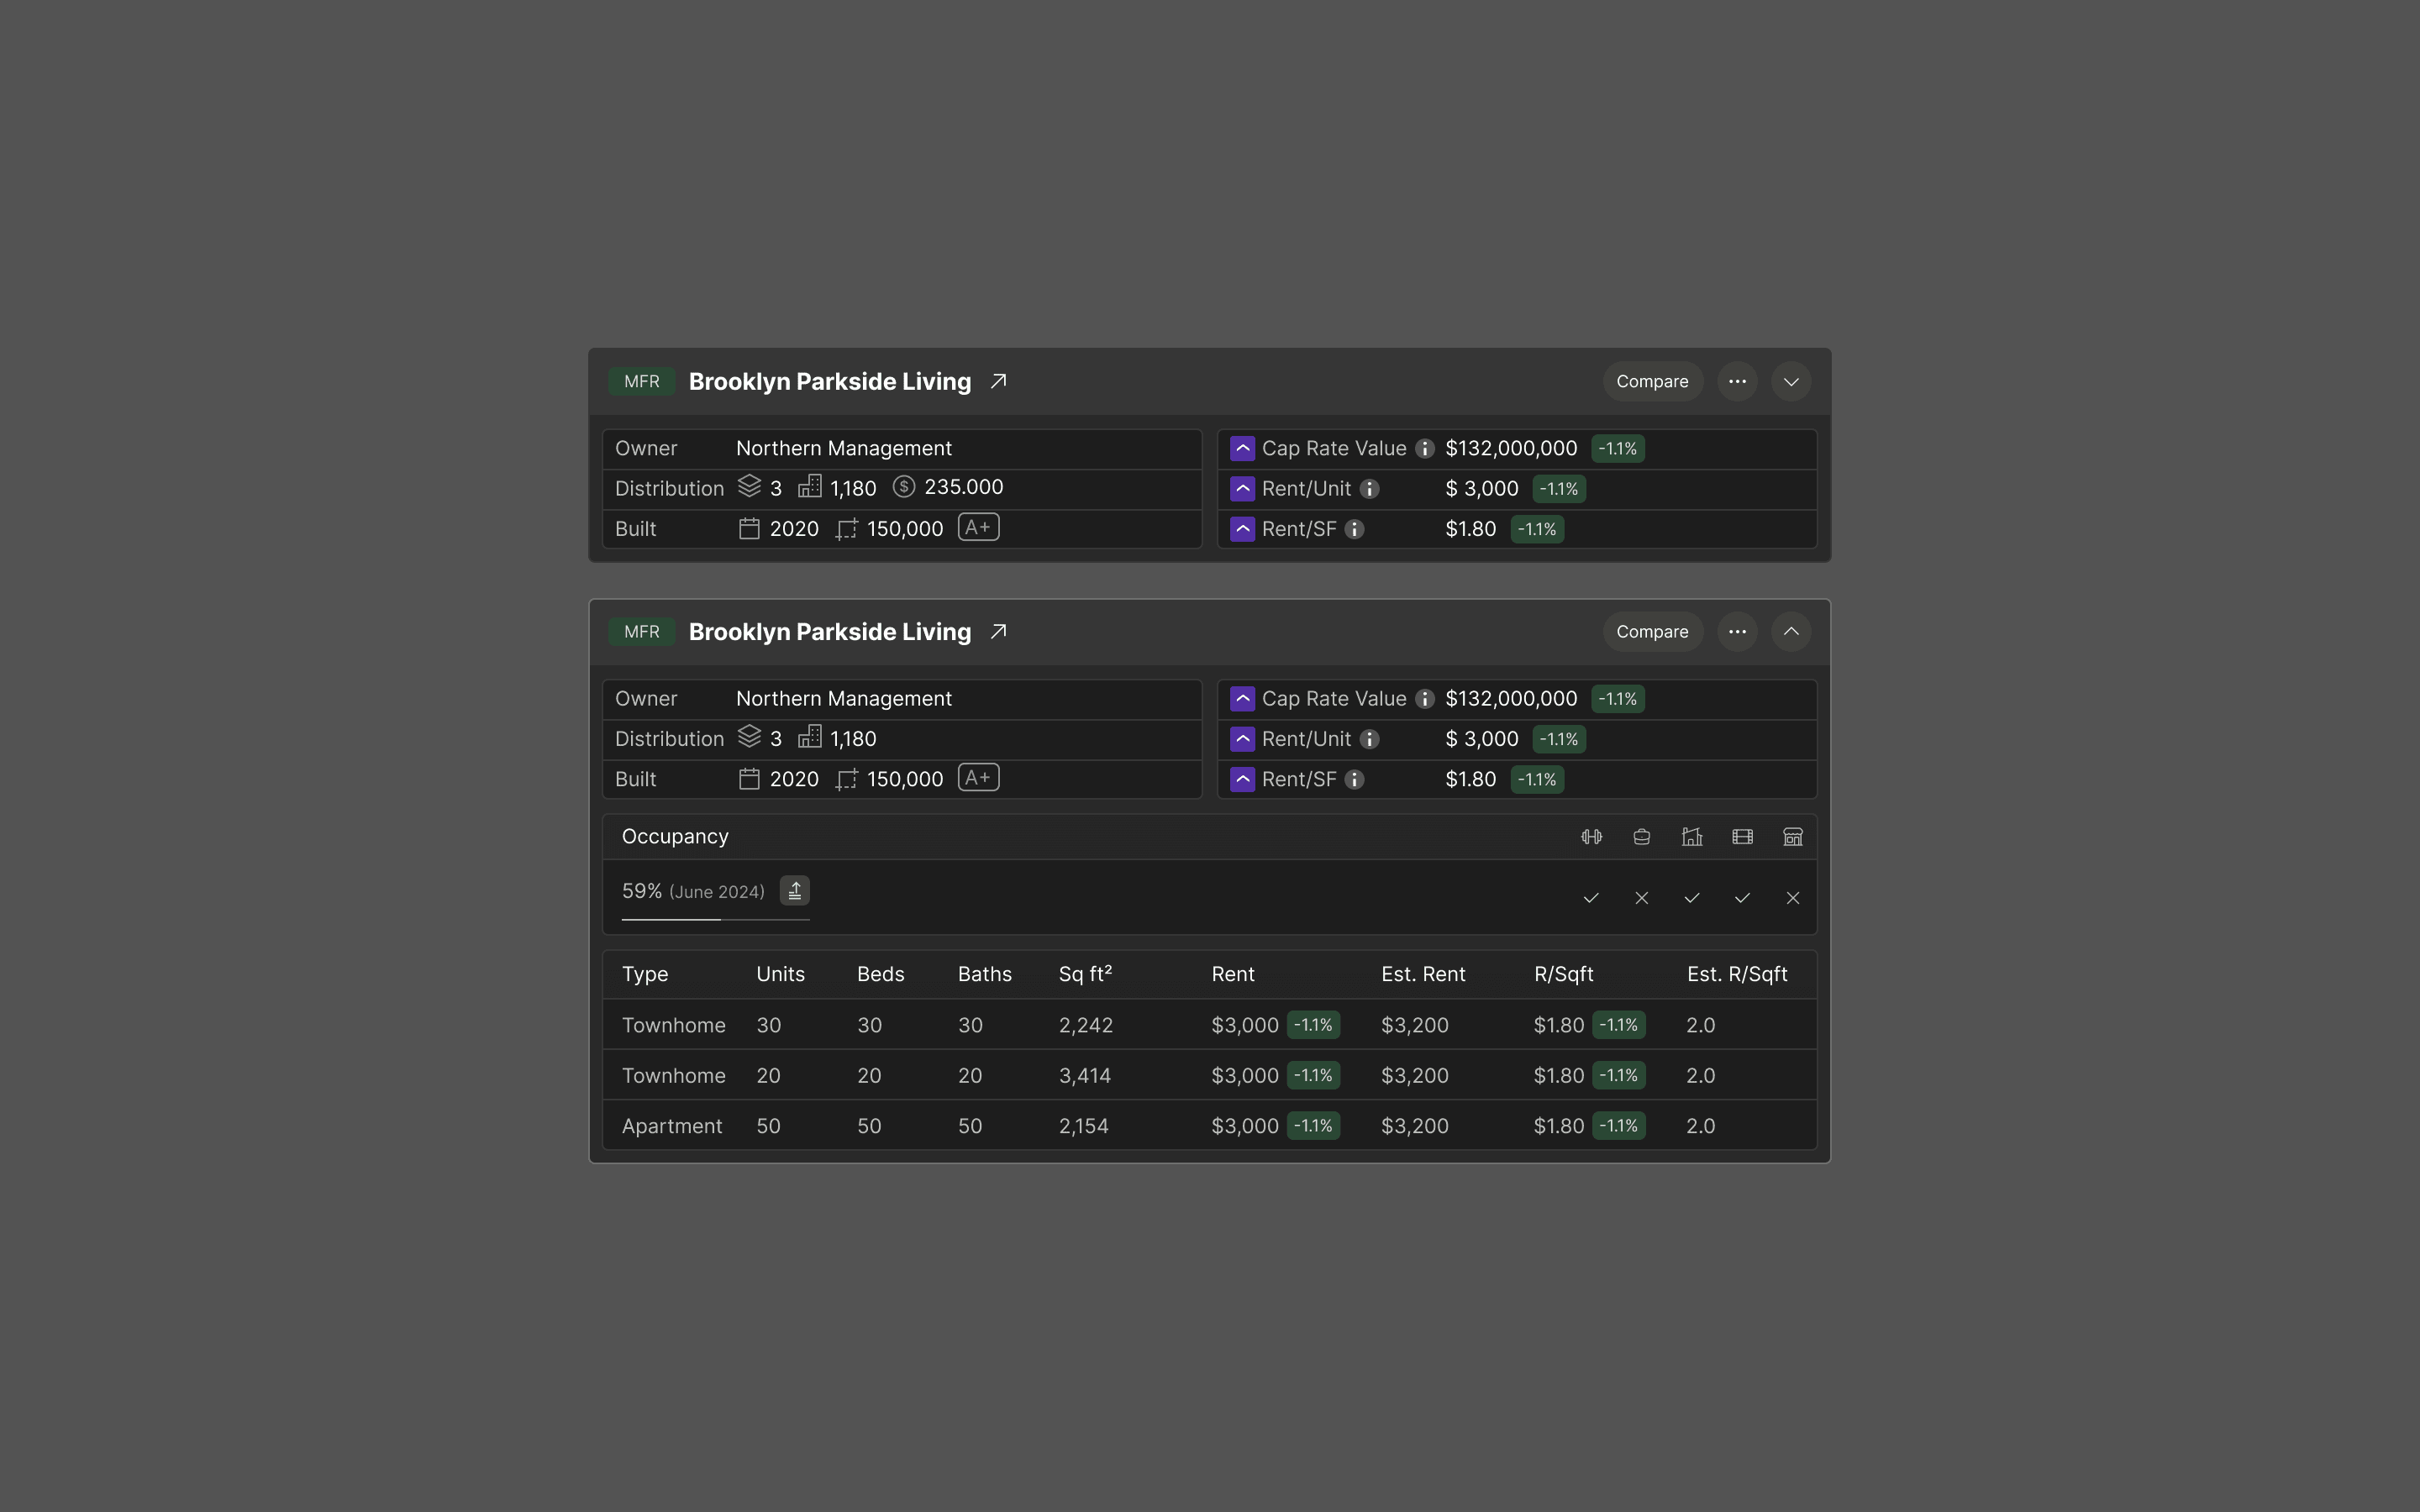
Property detail — unit mix and rent data for a prospective acquisition.